Cost Optimization for Databricks Workloads
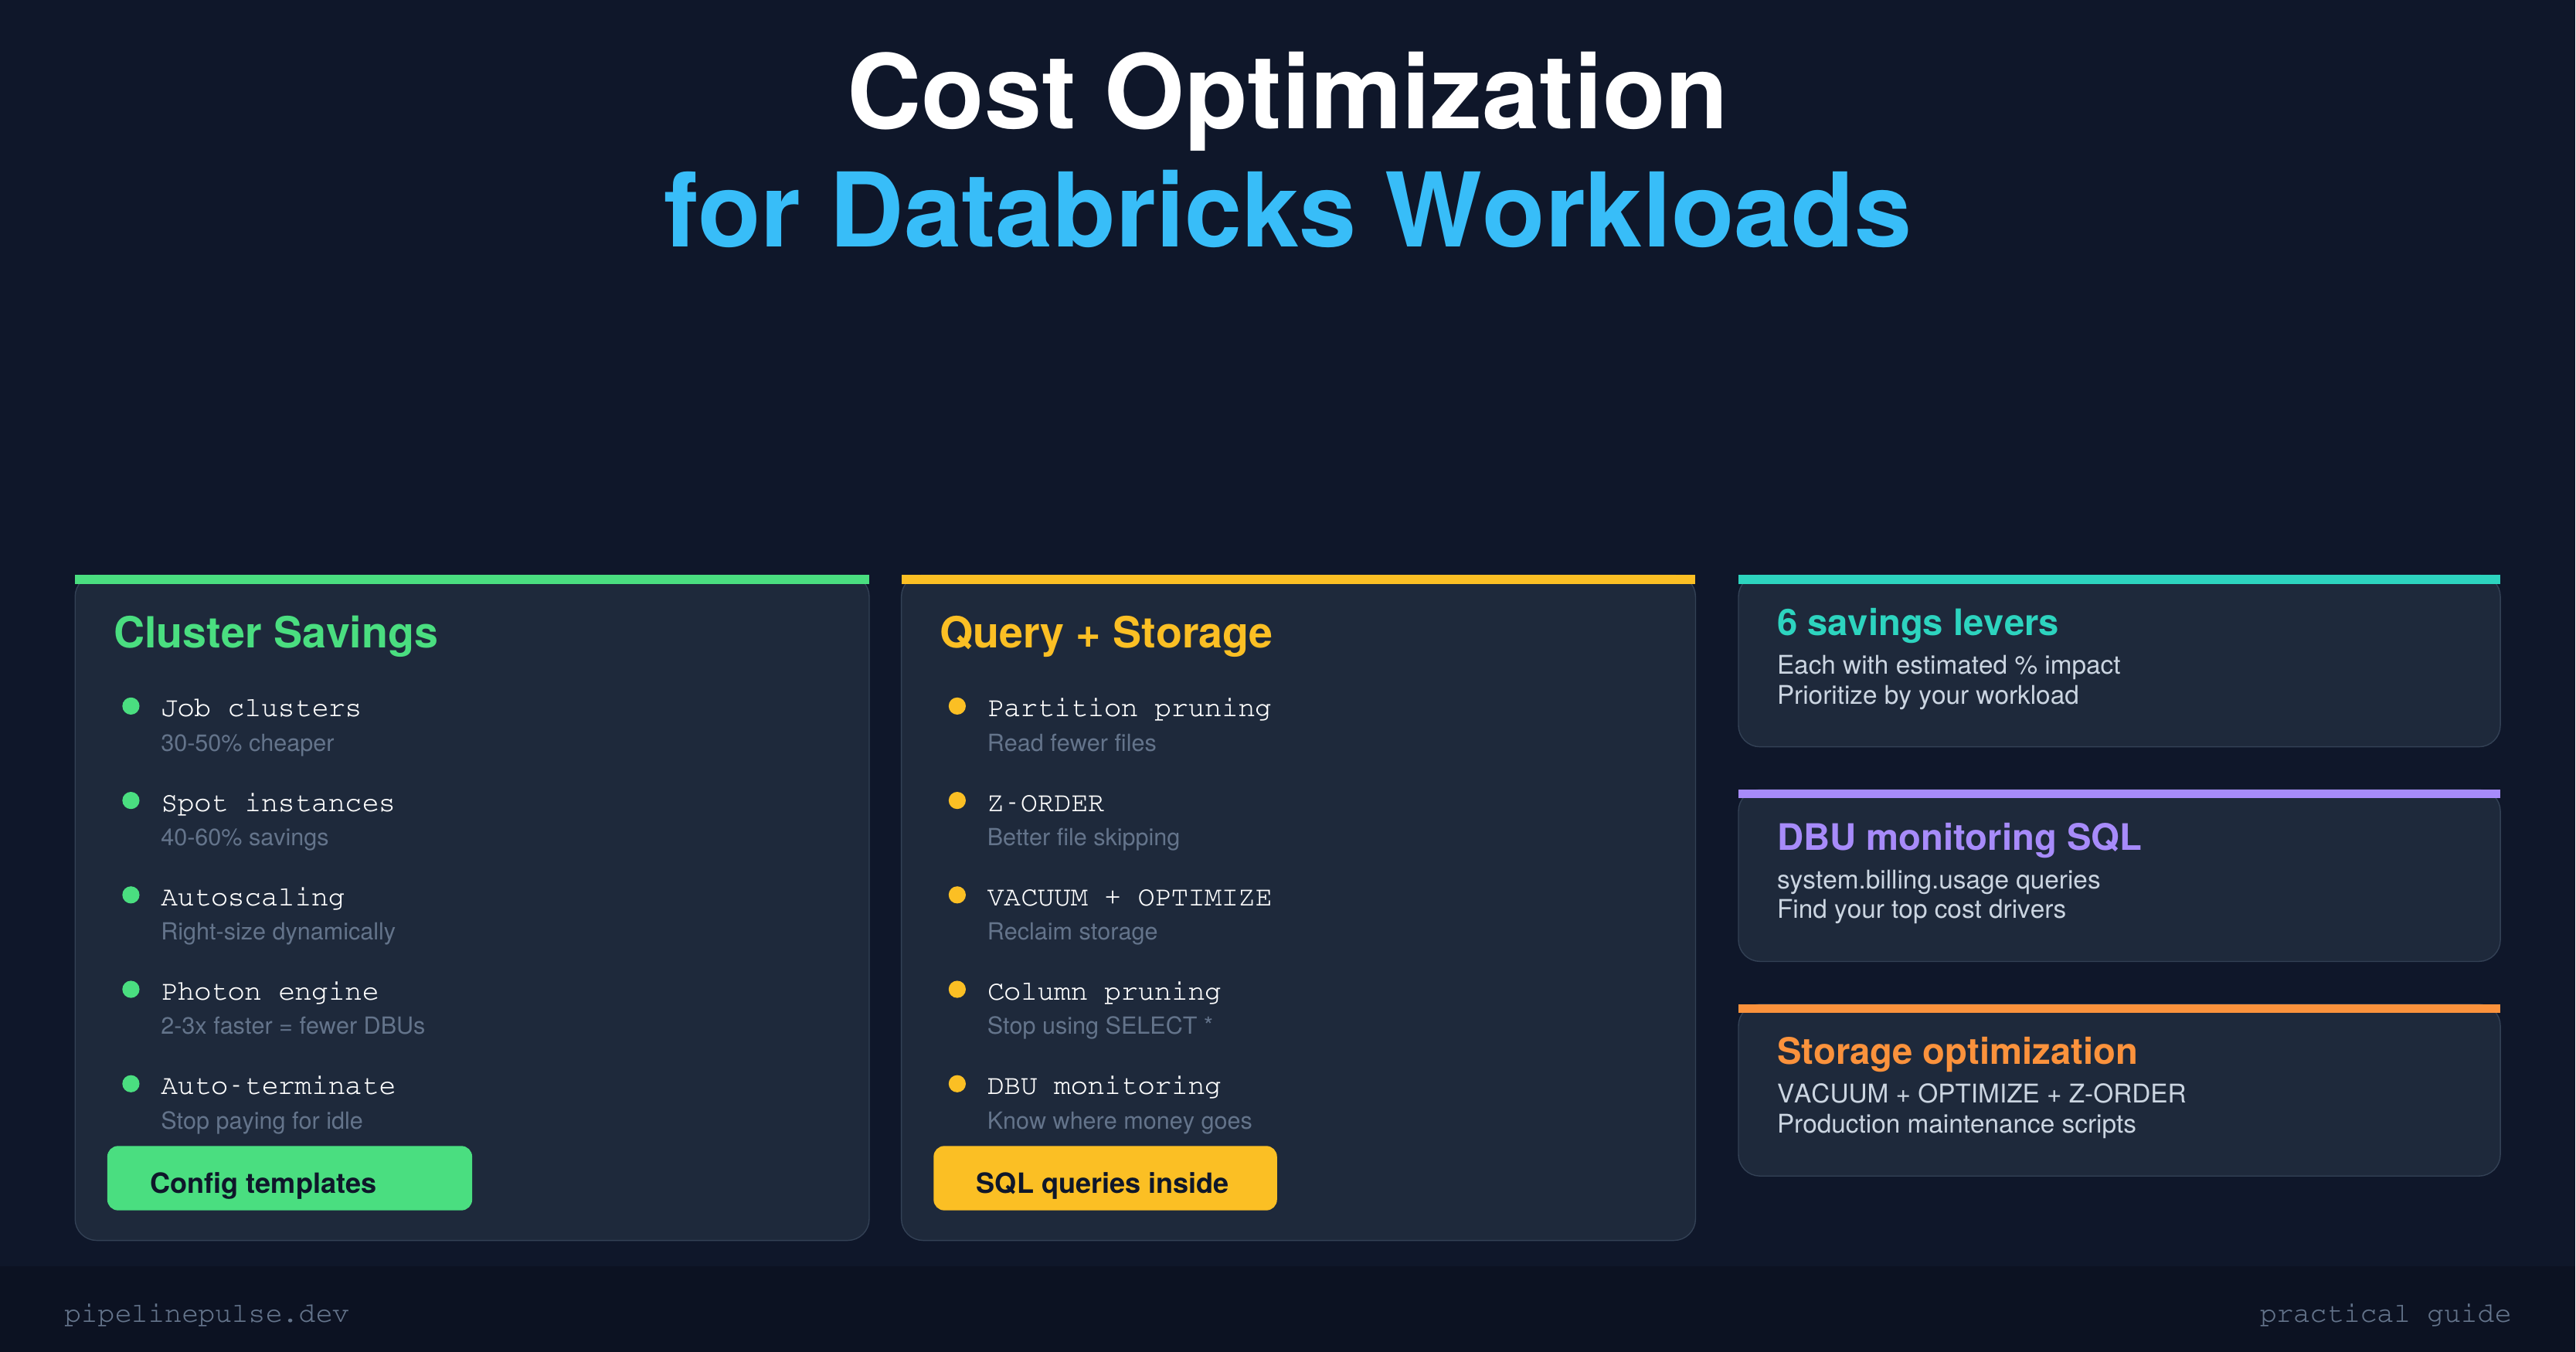
Reduce your Databricks bill by 30-60% with 6 proven cost levers — job clusters, spot instances, autoscaling, Photon, query tuning, and DBU monitoring. Includes config templates, an implementation checklist, and the common gotchas that waste money.

Your Databricks bill is higher than it needs to be. I can say that with confidence because almost every team I've talked to is overspending — usually by 30-50% — on things that are straightforward to fix.
The problem isn't Databricks being expensive. It's that the defaults are designed for convenience, not cost efficiency. All-purpose clusters that run 24/7, no spot instances, no autoscaling, SELECT * everywhere — these add up fast.
This guide covers every lever you can pull to reduce costs without sacrificing performance. Some of these I've implemented at SOCAR and seen immediate impact.
The 6 Cost Levers
Every Databricks cost optimization falls into one of these six categories. I've ranked them by estimated impact so you know where to focus first.
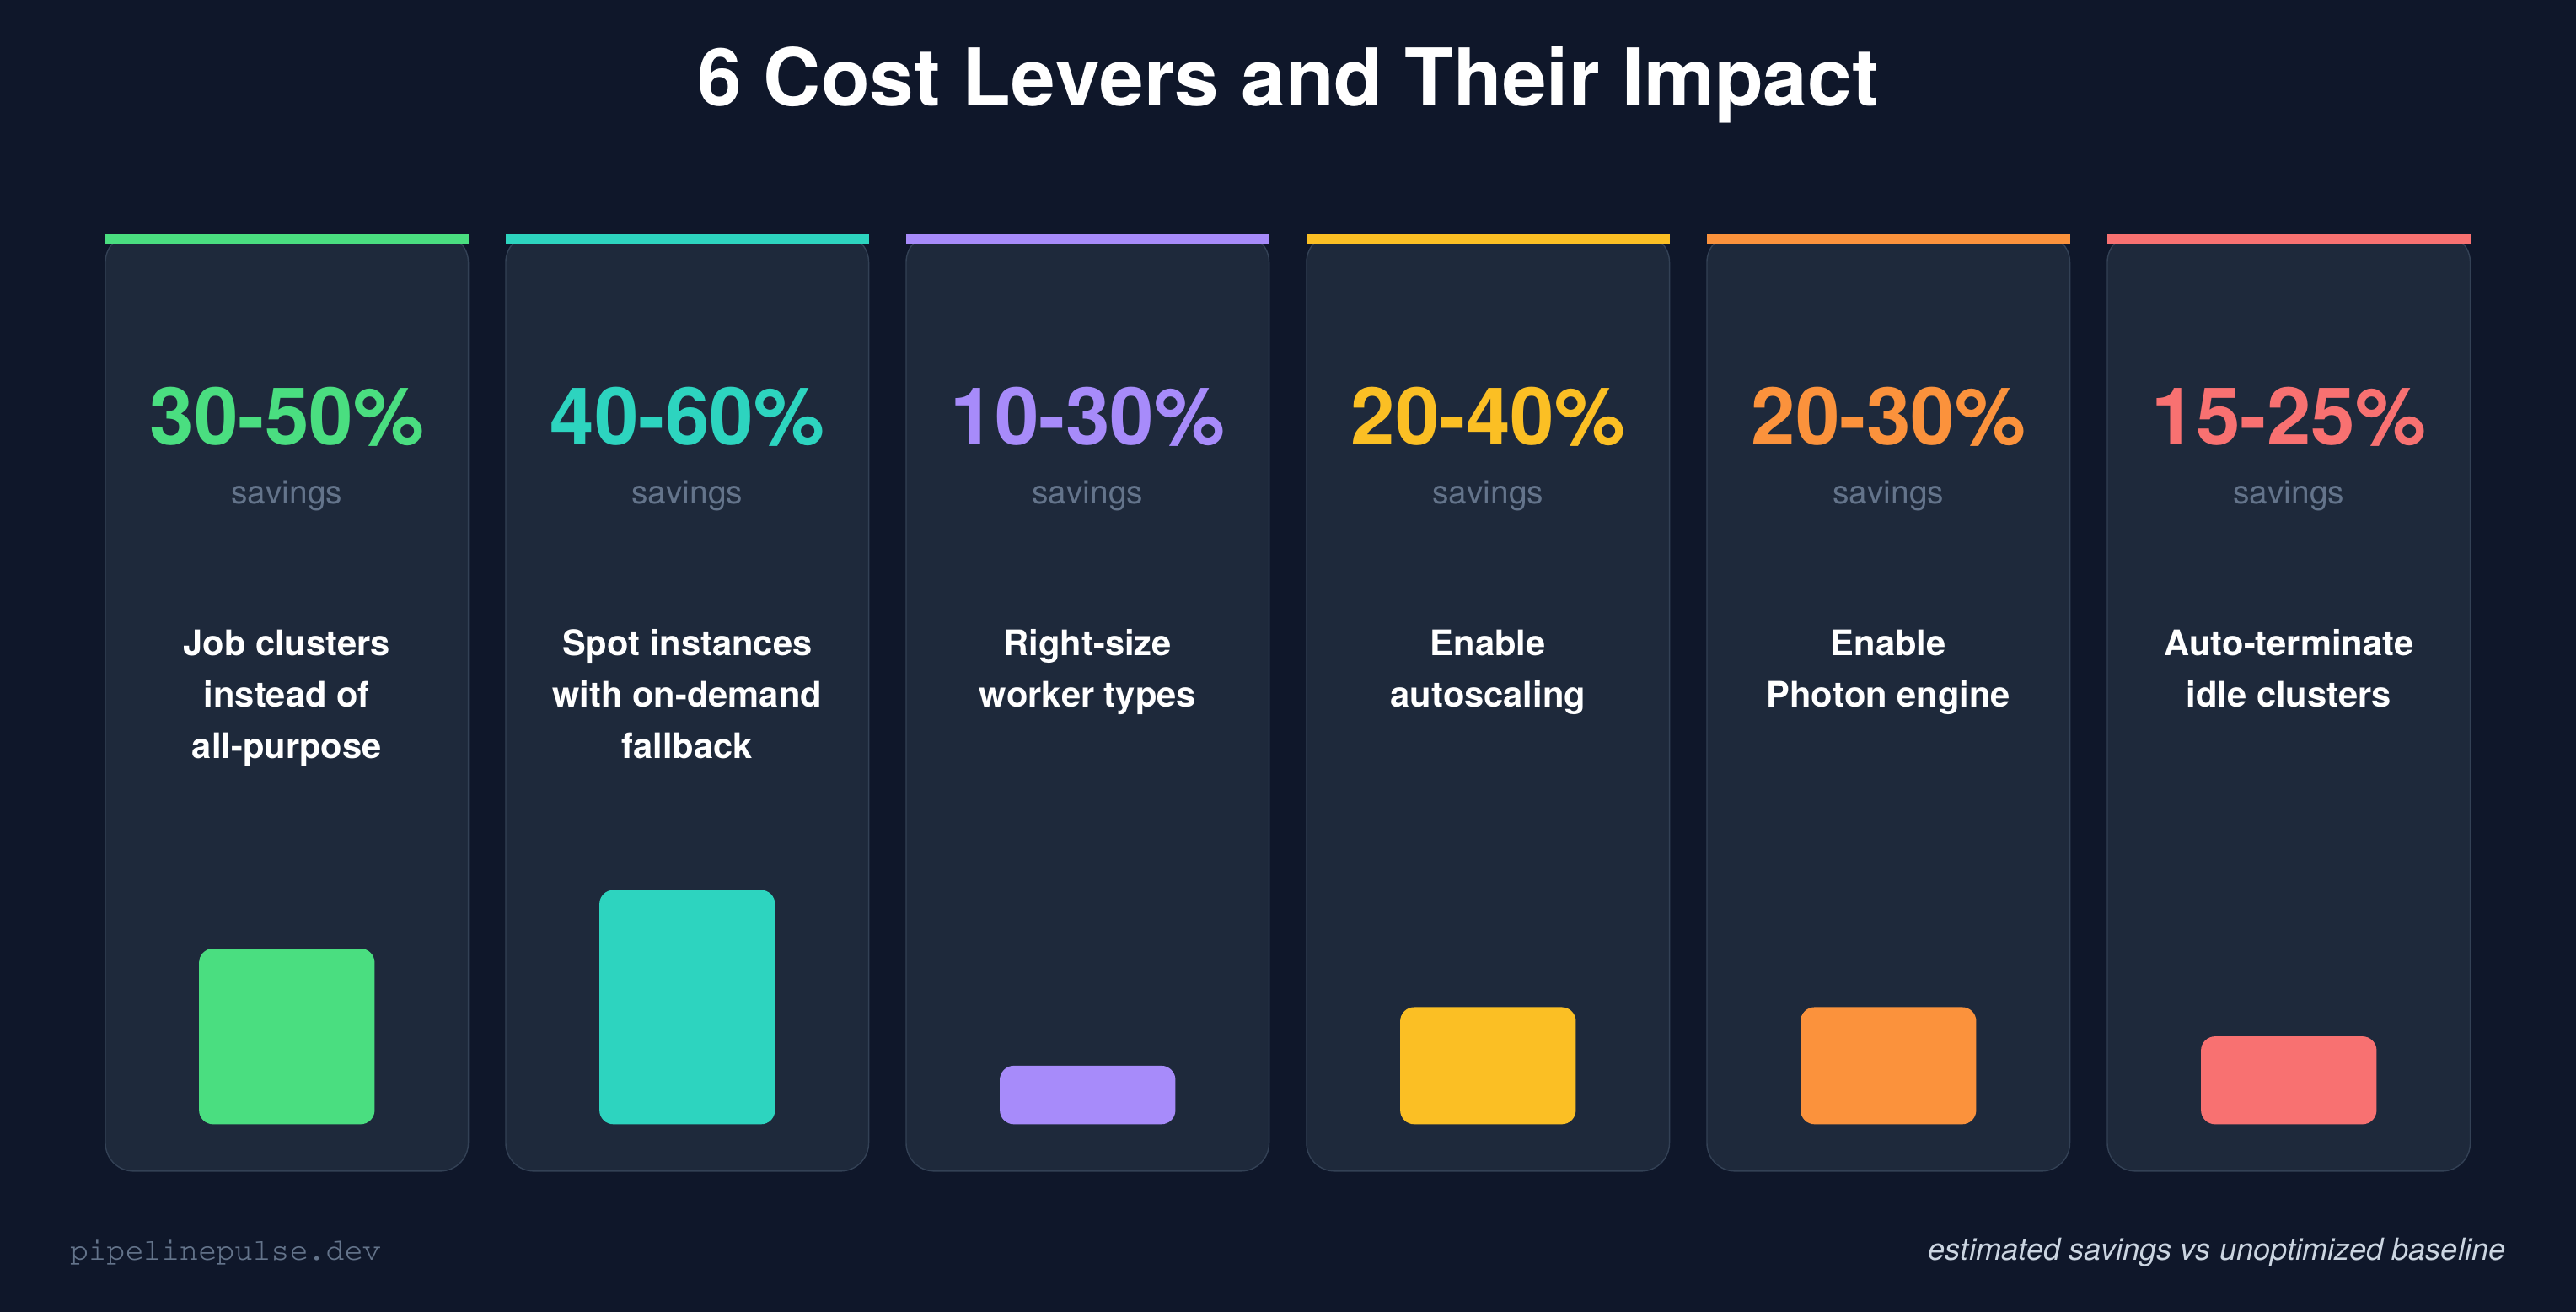
Let me break down each one.
1. Use Job Clusters, Not All-Purpose (30-50% savings)
This is the single highest-impact change most teams can make.
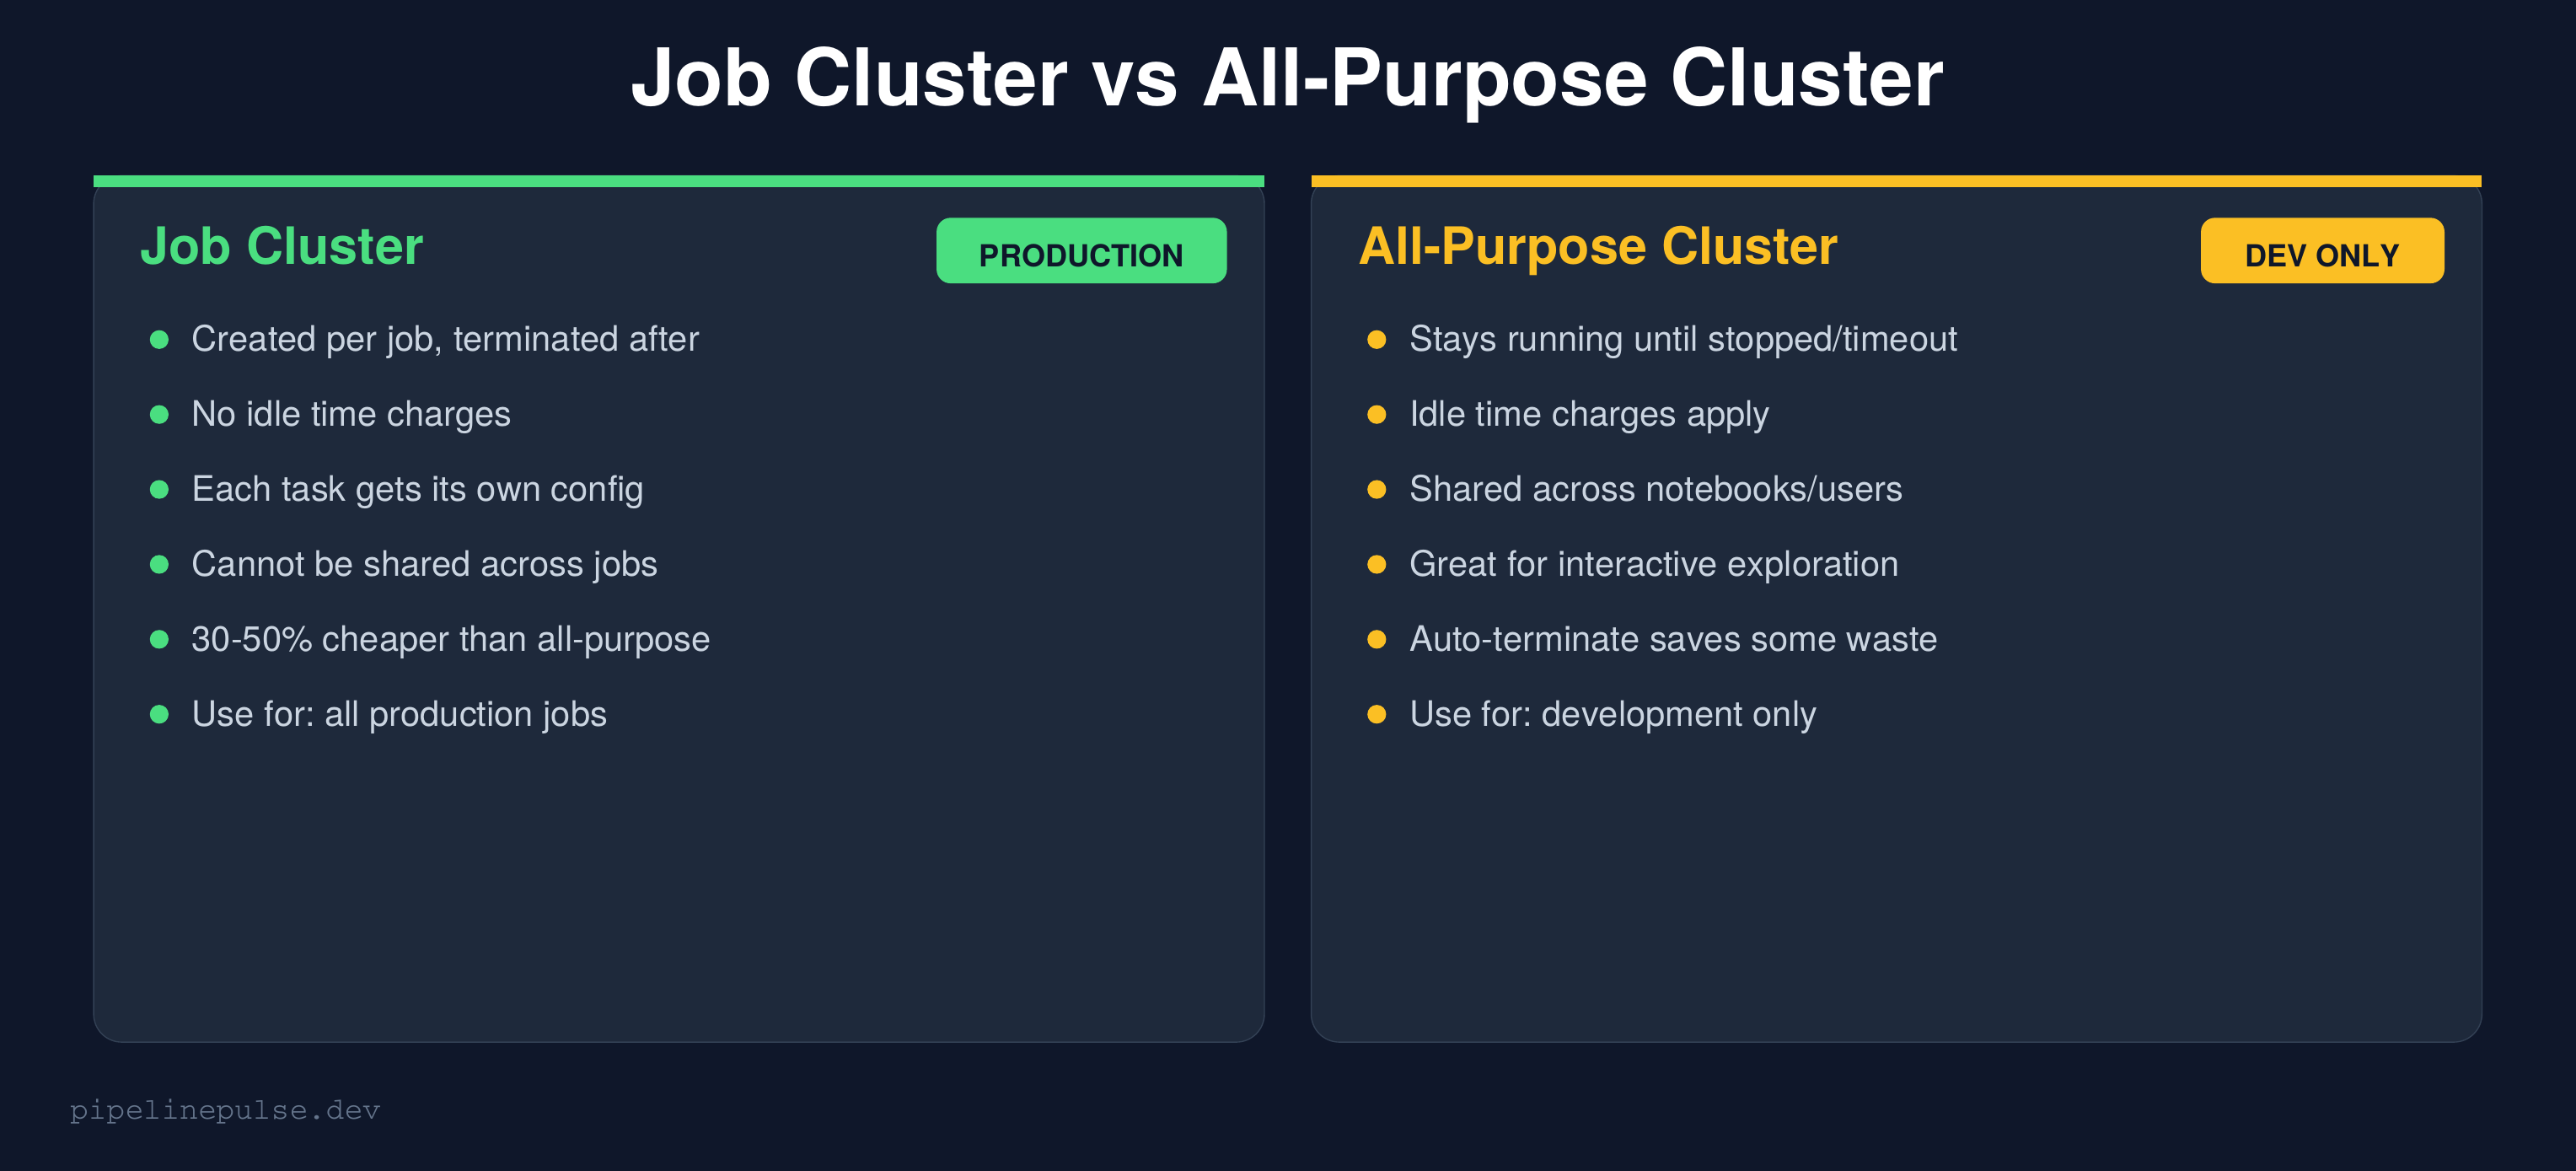
All-purpose clusters stay running until someone stops them or the auto-terminate timeout kicks in. Even with a 30-minute timeout, you're paying for idle time between interactive sessions, overnight when nobody's working, and on weekends.
Job clusters are created when a job starts and destroyed when it finishes. Zero idle time. Zero waste.
{
  "name": "orders_daily_etl",
  "tasks": [{
    "task_key": "run_etl",
    "notebook_task": {
      "notebook_path": "/pipelines/orders_etl"
    },
    "new_cluster": {
      "spark_version": "14.3.x-scala2.12",
      "node_type_id": "Standard_DS4_v2",
      "num_workers": 4,
      "spark_conf": {
        "spark.databricks.photon.enabled": "true"
      }
    }
  }]
}
The rule: All-purpose clusters are for interactive development only. Every scheduled job should use a job cluster. If you make this one change and do nothing else, you'll likely see 30-50% savings.
For more on setting up job clusters vs workflows, see my Databricks Jobs vs Workflows guide.
2. Use Spot Instances (40-60% savings)
Spot instances (called "preemptible VMs" on GCP) use spare cloud capacity at a steep discount. The trade-off: they can be reclaimed with short notice if the cloud provider needs the capacity back.
{
  "new_cluster": {
    "node_type_id": "Standard_DS4_v2",
    "num_workers": 8,
    "azure_attributes": {
      "first_on_demand": 1,
      "availability": "SPOT_WITH_FALLBACK_AZURE",
      "spot_bid_max_price": -1
    }
  }
}
Key settings:
first_on_demand: 1— keeps the driver node on-demand (reliable) and puts only workers on spotSPOT_WITH_FALLBACK— automatically falls back to on-demand if spot capacity isn't availablespot_bid_max_price: -1— use the default max price (pays whatever the current spot rate is)
When NOT to use spot:
- Streaming jobs — spot eviction kills your stream mid-batch
- Long-running single-task jobs — if evicted at 95% completion, you restart from zero
- Jobs with no checkpointing — the work lost on eviction can't be recovered
For batch ETL that completes in under an hour, spot is almost always worth it.
3. Right-Size Worker Types (10-30% savings)
Most teams pick an instance type once and never change it. But different workloads have different needs:
| Workload type | What it needs | Recommended instance |
|---|---|---|
| ETL / transformations | Balanced CPU + memory | Standard_DS3_v2 / i3.xlarge |
| Heavy joins / shuffles | More memory | Standard_DS4_v2 / i3.2xlarge |
| ML training | GPU | NC-series / p-series |
| Light SQL queries | Minimal | Standard_DS3_v2 / m5.large |
| Streaming | Balanced, stable | Standard_DS4_v2 (no spot) |
How to check if you're over-provisioned:
- Go to Clusters → Your Cluster → Metrics tab
- Check CPU utilization — if it's consistently under 40%, you're over-provisioned
- Check Memory utilization — if it's under 50%, try a smaller instance type
A common mistake: using a Standard_DS5_v2 (56GB RAM) for a job that peaks at 15GB memory usage. Downgrading to Standard_DS3_v2 (14GB RAM) cuts the per-node cost by 75%.
4. Enable Autoscaling (20-40% savings)
Autoscaling adjusts the number of workers based on workload demand. Instead of running 8 workers for a job that only needs 8 workers during the shuffle phase (2 minutes) and 2 workers the rest of the time (28 minutes), autoscaling scales up for the peak and back down after.
{
  "autoscale": {
    "min_workers": 1,
    "max_workers": 8
  }
}
Rules of thumb:
- Batch ETL:
min_workers: 1, max_workers: 8-16— let it scale to zero between tasks - Interactive / dev:
min_workers: 1, max_workers: 4— keep it small - Streaming: Don't use autoscaling — streaming needs stable cluster size for consistent throughput. Use fixed workers instead.
The savings come from paying for min_workers during idle/light phases instead of max_workers the entire time.
5. Enable Photon (20-30% savings via speed)
Photon is Databricks' vectorized query engine. It doesn't directly reduce your per-hour cost — but it makes queries 2-3x faster, which means your jobs finish in less time and consume fewer DBUs.
-- Check if Photon is enabled on your cluster
SELECT * FROM spark_conf WHERE key LIKE '%photon%'

-- Enable via cluster config
-- spark.databricks.photon.enabled = true
{
  "new_cluster": {
    "runtime_engine": "PHOTON",
    "spark_version": "14.3.x-photon-scala2.12"
  }
}
When Photon helps most:
- SQL-heavy workloads (aggregations, joins, filters)
- Parquet/Delta reads with predicate pushdown
- Large shuffle operations
When it doesn't help:
- Python UDF-heavy workloads (Photon only accelerates Spark SQL/DataFrame operations)
- Streaming micro-batches that are already sub-second
6. Auto-Terminate Idle Clusters (15-25% savings)
This one is embarrassingly simple but often missed. Set an auto-terminate timeout on every interactive cluster:
{
  "autotermination_minutes": 15
}
| Use case | Recommended timeout |
|---|---|
| Interactive development | 10-15 minutes |
| Shared team cluster | 20-30 minutes |
| Scheduled jobs | Not applicable (job clusters auto-terminate) |
| Streaming | Never (streaming must stay running) |
Go to Compute → Edit → Advanced → Auto Termination and verify every interactive cluster has a timeout set. I've seen teams pay thousands per month for clusters that were accidentally left running overnight.
Storage Cost Optimization
Compute is usually the biggest cost, but storage adds up too — especially if you're not maintaining your Delta tables.
-- Check table size
DESCRIBE DETAIL catalog.schema.my_table
-- Look at: sizeInBytes, numFiles

-- Compact small files (reduces scan costs on read)
OPTIMIZE catalog.schema.my_table

-- Z-ORDER on frequently filtered columns (improves file skipping)
OPTIMIZE catalog.schema.my_table ZORDER BY (date, region)

-- Delete old versions to reclaim storage
VACUUM catalog.schema.my_table RETAIN 168 HOURS

-- Enable auto-compaction (no manual OPTIMIZE needed)
ALTER TABLE my_table SET TBLPROPERTIES (
    'delta.autoOptimize.optimizeWrite' = 'true',
    'delta.autoOptimize.autoCompact' = 'true'
)
For a deeper dive on table maintenance, see my guide on OPTIMIZE, Z-ORDER, and VACUUM.
Quick wins:
- Run VACUUM on all tables weekly to delete old versions
- Enable auto-compaction on tables that receive frequent small writes
- Z-ORDER on columns you filter by most in your queries
Query Cost Optimization
The way you write queries directly affects how many DBUs you burn.
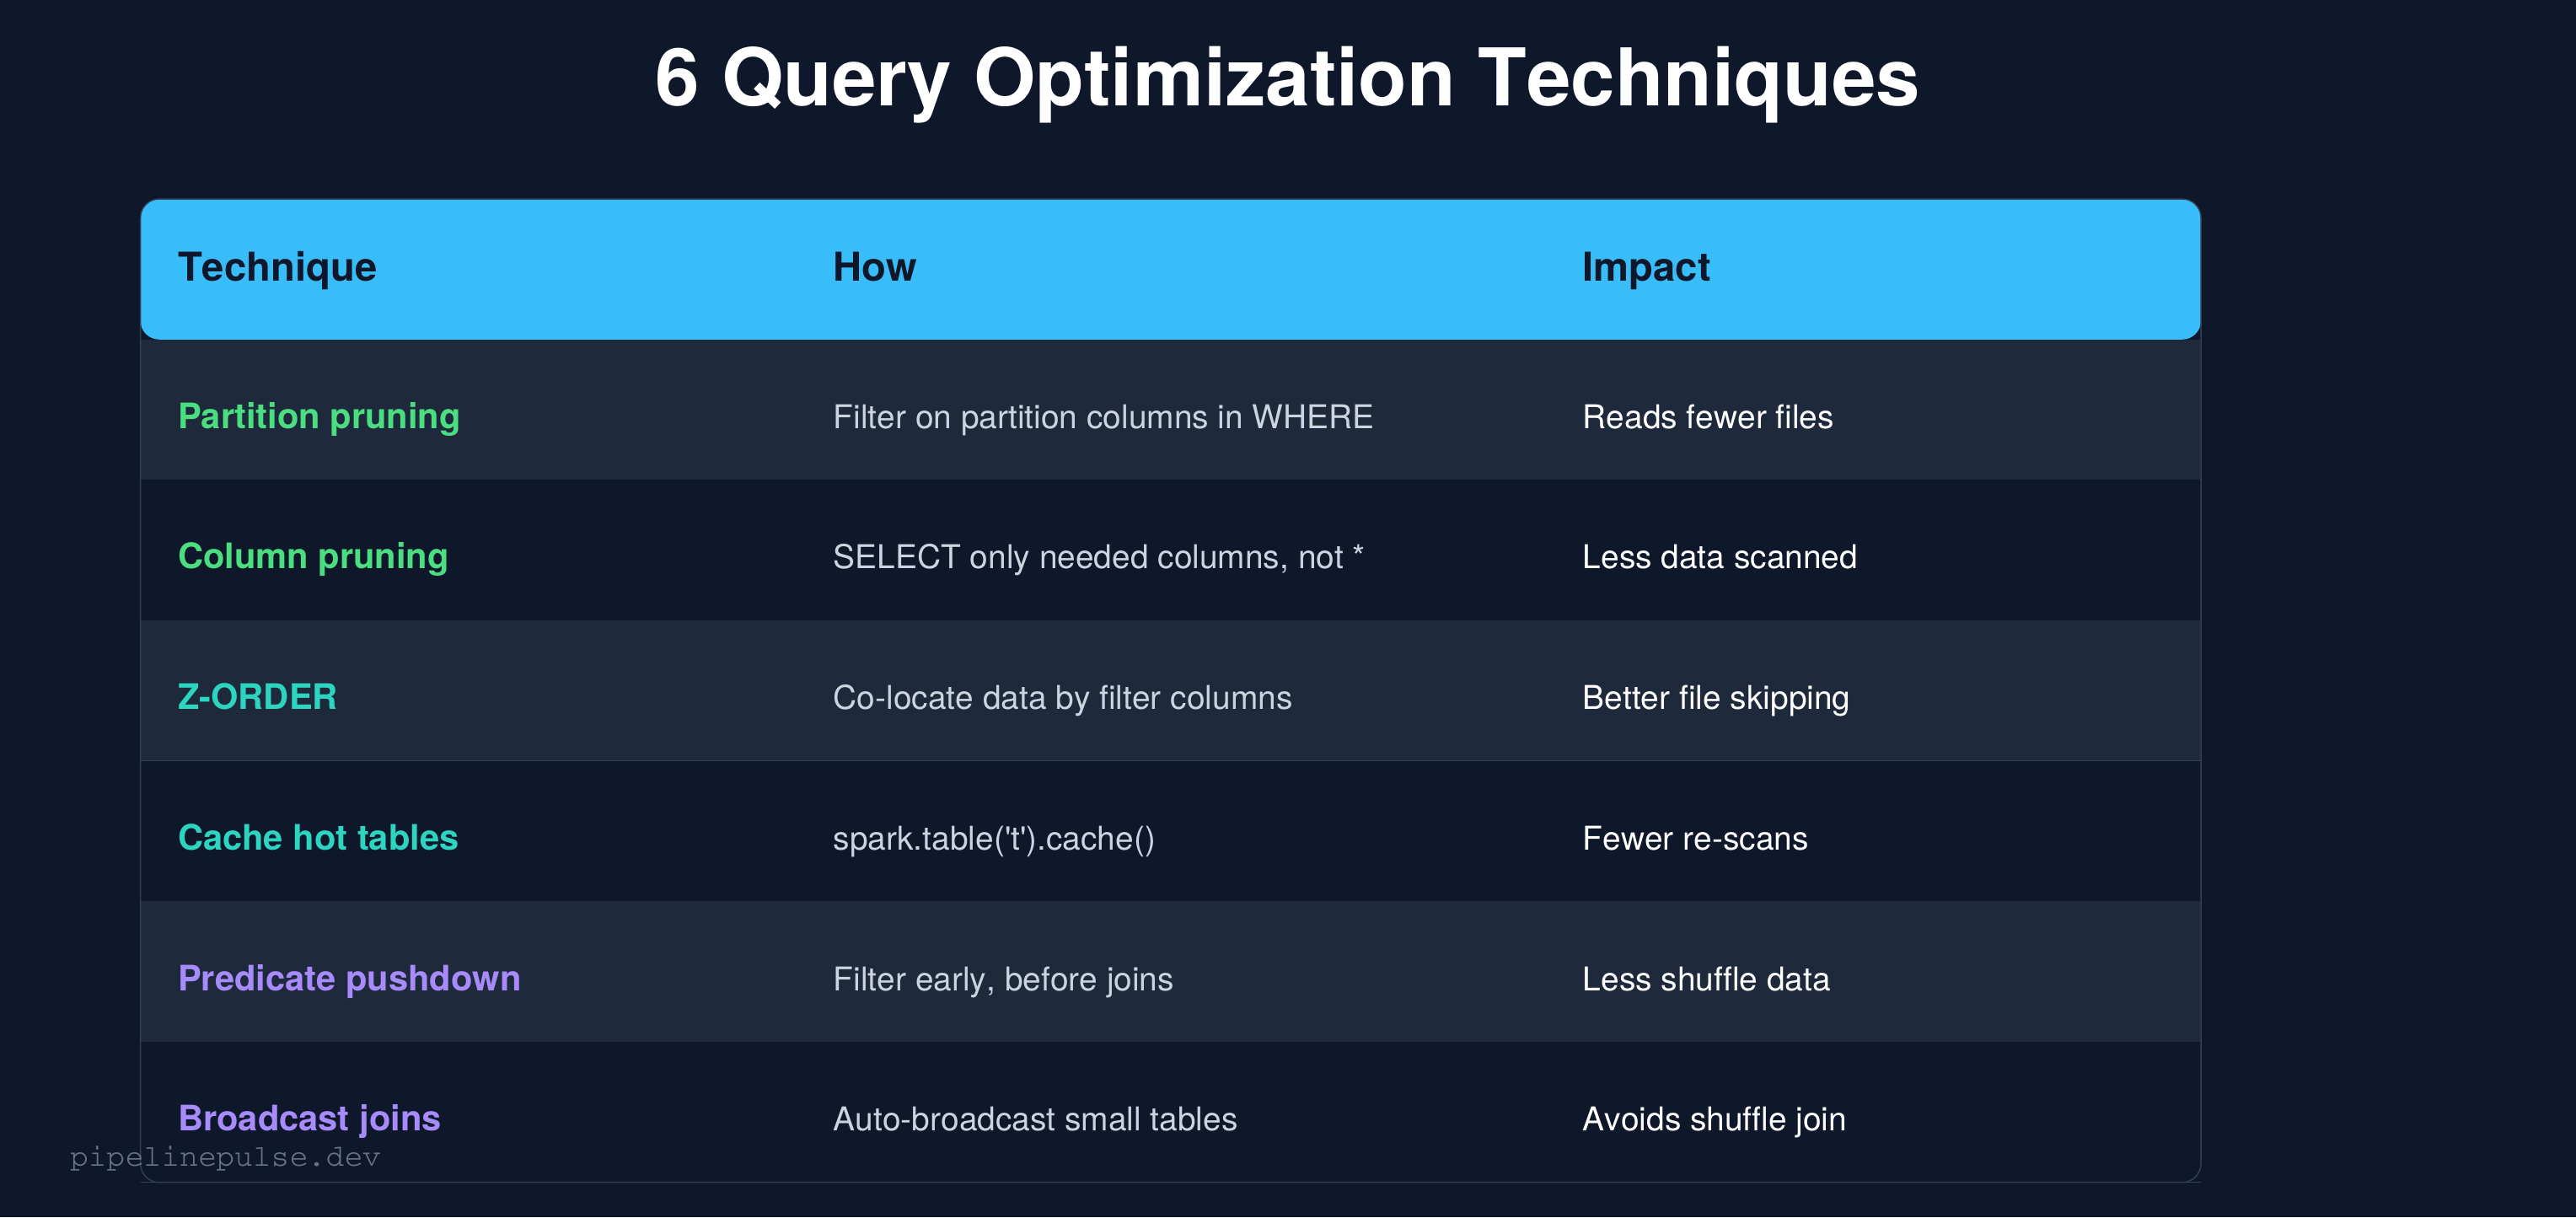
Stop using SELECT *
-- BAD: reads every column from disk
SELECT * FROM catalog.silver.orders WHERE date = '2026-03-20'

-- GOOD: reads only the columns you need
SELECT order_id, customer_id, amount
FROM catalog.silver.orders
WHERE date = '2026-03-20'
Delta Lake stores data in columnar format (Parquet). SELECT * reads every column from disk, even if you only need 3. On a table with 50 columns, you're reading 16x more data than necessary.
Filter early, join late
# BAD: join first, filter later (shuffles all data)
joined = orders.join(customers, 'customer_id')
result = joined.filter(F.col('order_date') == '2026-03-20')

# GOOD: filter first, join smaller dataset
filtered_orders = orders.filter(F.col('order_date') == '2026-03-20')
result = filtered_orders.join(customers, 'customer_id')
Use broadcast joins for small tables
from pyspark.sql import functions as F

# If one side of the join is < 50MB, broadcast it
result = large_df.join(F.broadcast(small_lookup_df), 'key_column')

# Or set the threshold globally
spark.conf.set('spark.sql.autoBroadcastJoinThreshold', '50m')
Broadcast joins send the small table to every executor, avoiding an expensive shuffle. The default threshold is 10MB — increase it to 50MB if your lookup tables are larger.
DBU Monitoring
You can't optimize what you don't measure. If your workspace has Unity Catalog enabled, you can query billing data directly:
-- DBU usage by cluster (last 30 days)
SELECT
    cluster_id,
    usage_date,
    SUM(usage_quantity) AS total_dbus
FROM system.billing.usage
WHERE usage_date >= DATE_SUB(CURRENT_DATE(), 30)
GROUP BY 1, 2
ORDER BY total_dbus DESC

-- Top cost drivers by workload type
SELECT
    sku_name,
    SUM(usage_quantity) AS total_dbus
FROM system.billing.usage
WHERE usage_date >= DATE_SUB(CURRENT_DATE(), 30)
GROUP BY sku_name
ORDER BY total_dbus DESC
If you don't have system tables access, use the Account Console → Usage tab for a manual overview.
What to look for:
- Which clusters are consuming the most DBUs?
- Are any all-purpose clusters running 24/7?
- Is the ratio of interactive vs job DBUs healthy? (Target: >80% job, <20% interactive)
Implementation Checklist
Here's the order I'd tackle these in, from quickest wins to longer-term optimizations:
Week 1 — immediate wins:
- Switch all scheduled jobs from all-purpose to job clusters
- Set auto-terminate on every interactive cluster (10-15 min)
- Enable spot instances on batch ETL jobs
Week 2 — query and storage:
- Audit top 10 most expensive queries — eliminate
SELECT * - Run OPTIMIZE + VACUUM on all production tables
- Enable auto-compaction on high-write tables
Week 3 — ongoing:
- Enable Photon on production job clusters
- Right-size worker types using metrics data
- Set up DBU monitoring queries as a weekly check
Ongoing:
- Review DBU usage monthly
- Right-size autoscaling min/max as workloads change
- Z-ORDER tables as query patterns evolve
Common Gotchas
1. All-purpose clusters for production jobs is the #1 cost waste. I keep saying it because it's that important. Job clusters alone can cut 30-50% off your bill.
2. Spot instances without fallback will fail. Always use SPOT_WITH_FALLBACK, not just SPOT. Pure spot jobs fail when capacity isn't available.
3. Autoscaling for streaming is a mistake. Streaming needs stable throughput. Scaling workers up and down mid-stream causes micro-batch latency spikes.
4. VACUUM too aggressively loses time travel. RETAIN 168 HOURS (7 days) is the safe default. Don't go below 24 hours in production.
5. Photon doesn't help Python UDFs. If your workload is UDF-heavy, Photon won't speed it up. Focus on converting UDFs to native Spark functions instead.
6. Oversized clusters for small tables are common. If your table is 1GB, you don't need an 8-worker cluster. Profile your data sizes before setting cluster configs.
Get the Checklist
Want all these optimization strategies in a printable checklist with config templates and DBU monitoring queries? Grab the Databricks Cost Optimization Checklist on Gumroad for $4.99.
Also check out:
- Databricks Debugging Kit ($4.99) — when cost-saving configs cause failures
- Pipeline Architecture Templates ($4.99) — production pipeline patterns
- Delta Table Troubleshooting Checklist ($9)
- Data Quality Monitoring Playbook ($4.99)
- Data Observability Toolkit ($4.99)
Building data pipelines that don't break at 3am? That's what PipelinePulse is about. More guides at pipelinepulse.dev.