How to Debug Failing Databricks Pipelines
A systematic approach to debugging Databricks pipeline failures. Covers OOM errors, missing transaction logs, schema mismatches, MERGE duplicates, JDBC NaN issues, and streaming checkpoint corruption — with error decision trees, log reading guides, cluster config checklists, and performance fixes.

Your Databricks job failed at 3am. You open the run page to a wall of red text, a stack trace that mentions three different Java exceptions, and no obvious clue about what actually went wrong.
I've been there more times than I'd like to admit. After years of debugging production pipelines at SOCAR, I've developed a systematic approach that gets to the root cause fast — without randomly changing cluster configs and hoping for the best.
This guide covers the most common Databricks failures, how to read the logs that actually matter, and the fixes that work.
📄 Keep this debugging workflow offline
Get the Databricks Debugging Kit — error decision trees, log reading guide, cluster config checklist, and diagnostic commands in a printable PDF. $4.99
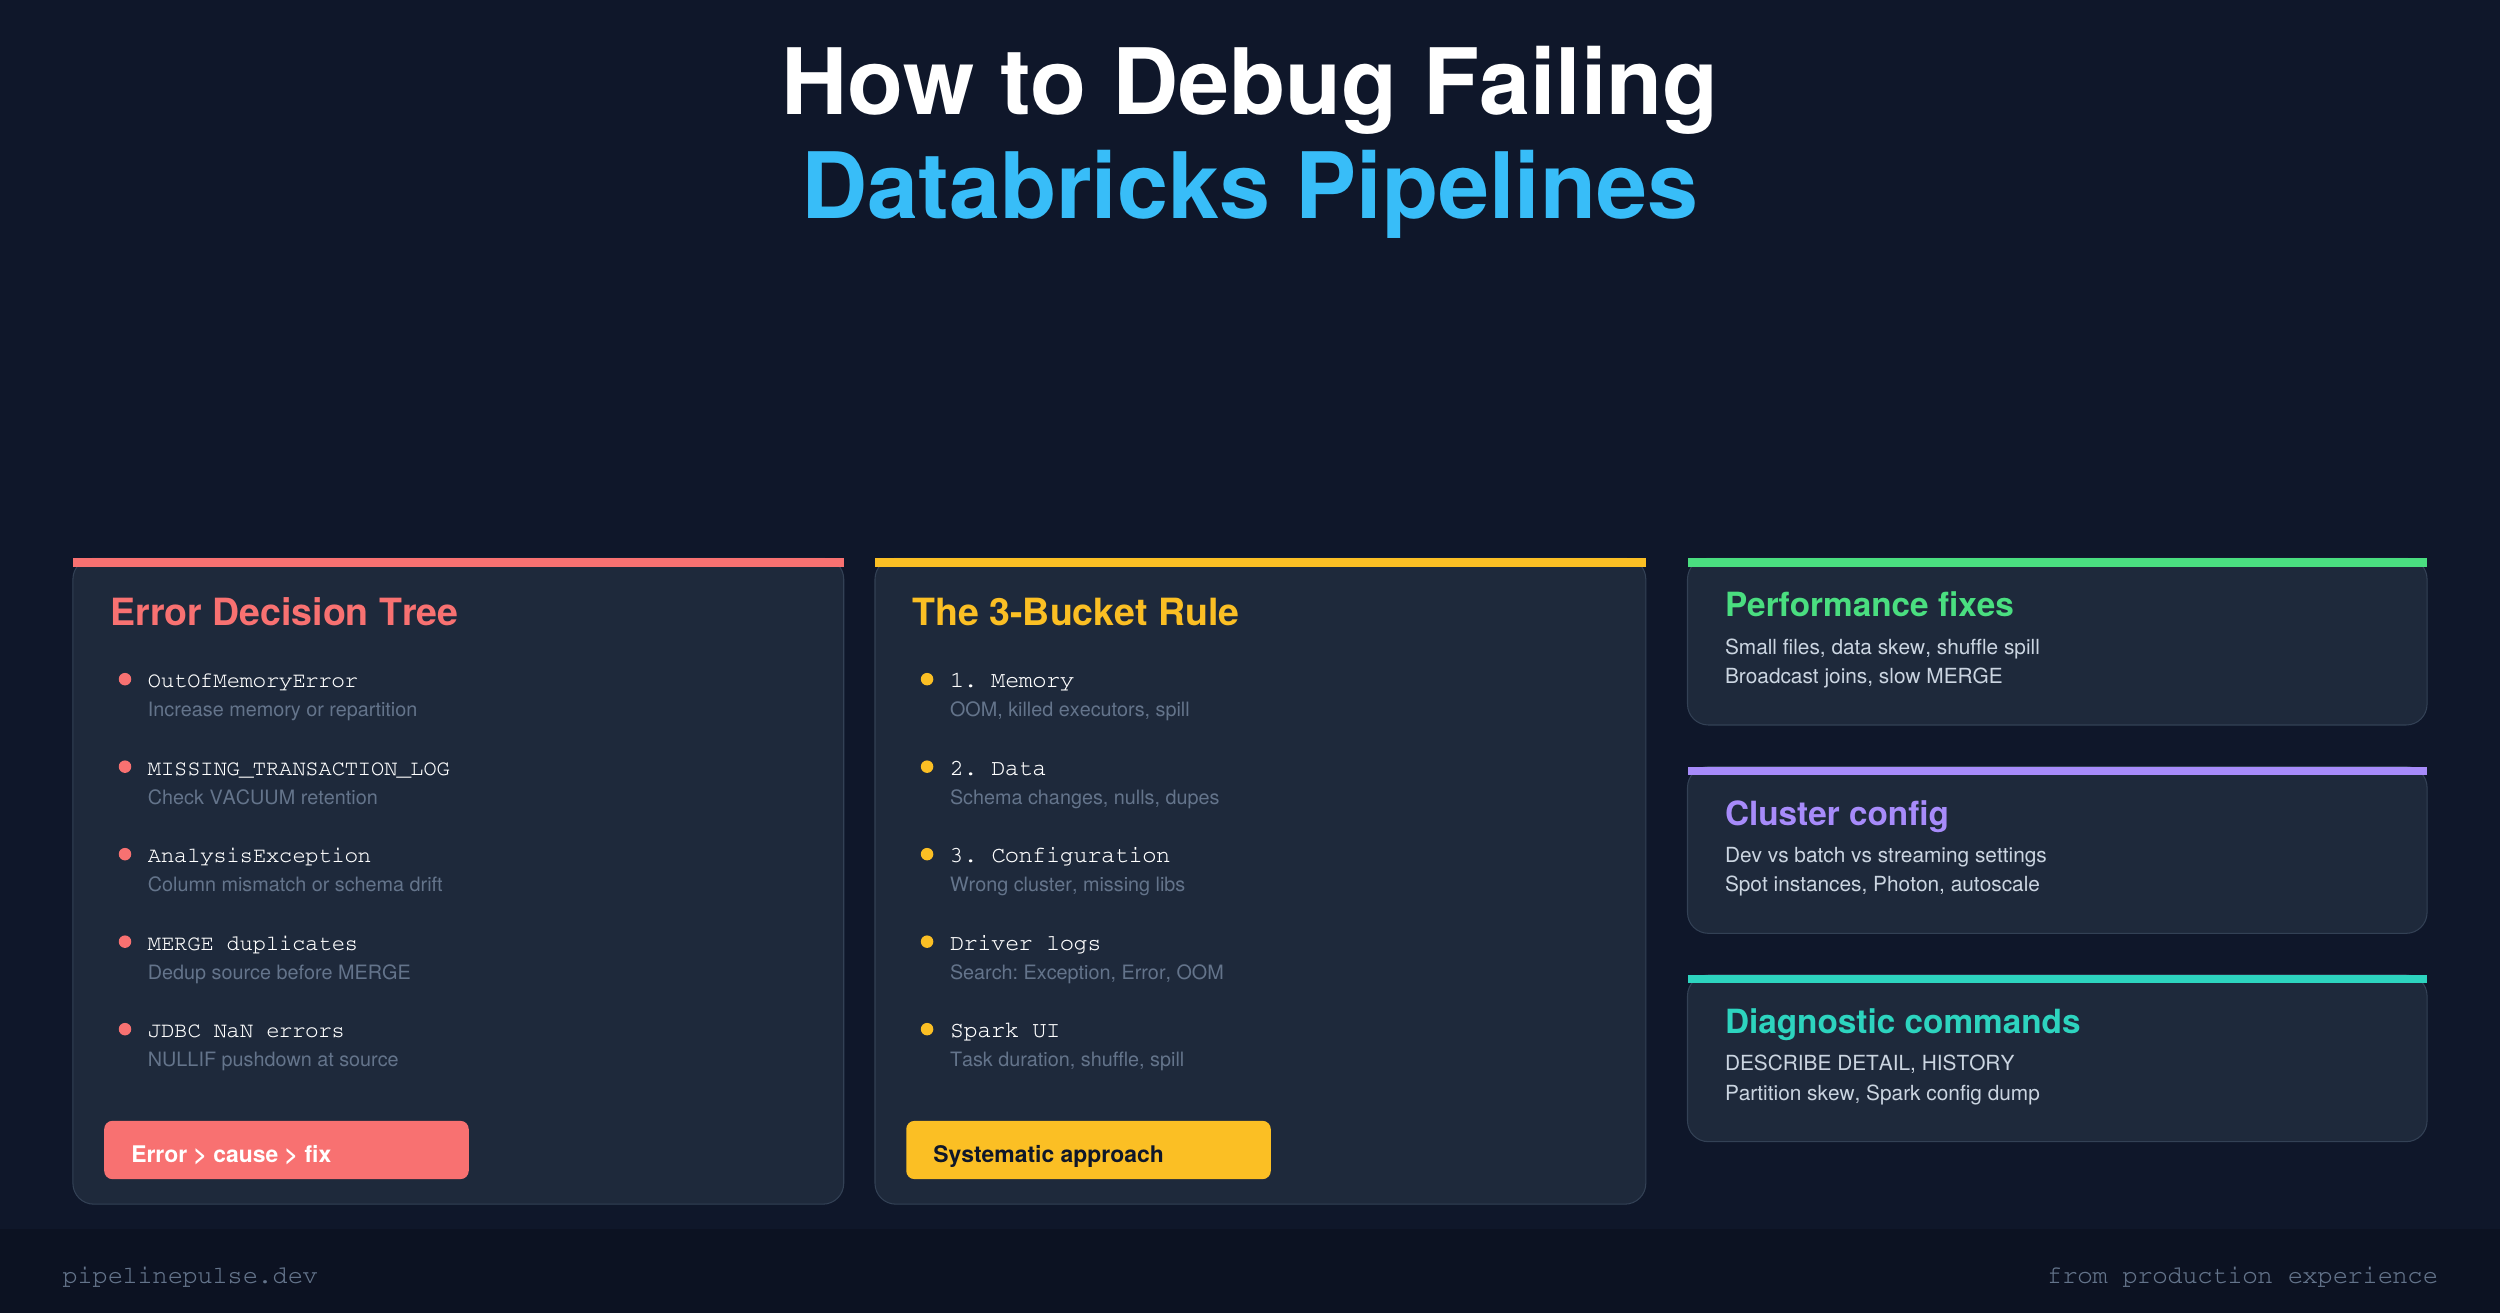
The 3-Bucket Rule
Almost every Databricks pipeline failure falls into one of three buckets:
- Memory — the job ran out of RAM (OOM errors, killed executors)
- Data — the input data is wrong (schema changes, duplicates, nulls, NaN values)
- Configuration — the cluster or job settings are wrong (wrong instance type, missing libraries, permissions)
Your first job when debugging is to figure out which bucket you're in. The fix is completely different for each one.
Step 1: Read the Right Logs
Most people look at the wrong logs. Here's where to actually find useful information:
Driver logs (start here)
Clusters → Your Cluster → Driver Logs tab
The driver log contains the actual exception that killed your job. Search for these keywords in order:
Exception
Error
OOM
killed
FAILED
The first match is usually your root cause. Everything after it is just cascading failure noise.
Spark UI (for performance issues)
Clusters → Your Cluster → Spark UI → Stages tab
Click the failed stage. Look at:
- Task duration distribution — if one task took 100x longer than the others, you have data skew
- Shuffle read/write — massive shuffle means you might need to repartition
- Spill (Memory) / Spill (Disk) — any spill means your executors need more memory or your data needs repartitioning
Event log (for cluster-level issues)
Clusters → Your Cluster → Event Log
Filter for executor lost or container killed. These indicate the cluster itself is struggling — usually an OOM at the executor level that Spark can't recover from.
Job run output
Workflows → Your Job → Run history → Click the failed run
This shows you the notebook output at the point of failure. Often the most readable error message is right here.
Step 2: Match the Error to the Fix
Here's the decision tree I use. Find your error message and follow the path:
SparkException: Job aborted
This is a generic wrapper — the real cause is in the nested exception. Look for the "Caused by:" line.
Caused by: OutOfMemoryError → Memory bucket. See OOM fixes below.
Caused by: FileNotFoundException → A data file was deleted while the job was reading it. Usually caused by a concurrent VACUUM or OPTIMIZE. Fix: increase VACUUM retention or schedule maintenance jobs to not overlap with ETL.
Caused by: AnalysisException → Data bucket. A column name doesn't exist, a type cast failed, or the table path is wrong. The error message usually tells you exactly which column or table is the problem.
DELTA_MISSING_TRANSACTION_LOG
The Delta transaction log is corrupted or the table path is wrong.
# Step 1: Verify the table exists
spark.sql("DESCRIBE DETAIL catalog.schema.my_table")

# Step 2: Check if _delta_log directory exists
dbutils.fs.ls('/path/to/table/_delta_log/')

# Step 3: If log is corrupted, check VACUUM history
spark.sql("DESCRIBE HISTORY catalog.schema.my_table LIMIT 10")
Most common cause: someone ran VACUUM with too aggressive a retention period and deleted files that active queries still needed. See my guide on VACUUM retention for safe settings.
AnalysisException: cannot resolve column
A column name in your code doesn't match the table's actual schema.
-- Check what columns actually exist
DESCRIBE TABLE catalog.schema.my_table

-- Compare with your code's expected columns
-- Look for: typos, renamed columns, dropped columns
If columns were recently renamed or dropped, someone may have enabled column mapping and made schema changes without updating downstream pipelines. This is why data contracts matter.
java.lang.OutOfMemoryError {#oom-fixes}
The single most common Databricks failure. Three sub-types:
Driver OOM — the driver ran out of memory, usually because of .collect(), .toPandas(), or a large broadcast join.
# BAD: pulling all data to driver
all_data = df.collect()  # OOM if df has millions of rows
pdf = df.toPandas()      # Same problem

# GOOD: limit first, or process on executors
sample = df.limit(10000).toPandas()
result = df.agg(F.count('*')).collect()  # small result is fine
Executor OOM — one or more executors ran out of memory during processing. Usually caused by:
- A single partition that's too large (data skew)
- A large shuffle operation
- Not enough memory for the workload
# Check for data skew
df.groupBy('partition_key').count().orderBy(F.desc('count')).show(10)
# If one partition has 10x more rows than others, that's your problem

# Fix: add a salt key to distribute the skewed key
from pyspark.sql import functions as F
df = df.withColumn('salt', F.concat(F.col('skewed_key'), F.lit('_'), (F.rand() * 10).cast('int')))
Metaspace OOM — rare, caused by too many classes loaded. Usually means too many UDFs or a library conflict. Restart the cluster and reduce UDF usage.
MERGE condition produced duplicate rows
Your MERGE source data has duplicates on the merge key. Delta Lake requires the source to match at most one row per target row.
# Find duplicates in your source
source_df.groupBy('merge_key').count().filter('count > 1').show()

# Fix: dedup before MERGE
from pyspark.sql import Window

w = Window.partitionBy('merge_key').orderBy(F.desc('updated_at'))
deduped = source_df.withColumn('rn', F.row_number().over(w)) \
                   .filter(F.col('rn') == 1) \
                   .drop('rn')
I covered this exact issue in detail in my duplicate records in Delta tables guide. It's the #1 reason MERGE operations fail.
PSQLException / JDBC errors with NaN
If you're reading from PostgreSQL via JDBC and hit Bad value for type BigDecimal: NaN, the source table has NaN values in numeric columns.
# Fix: push the NULLIF conversion to the JDBC query level
jdbc_df = spark.read.format('jdbc') \
    .option('url', jdbc_url) \
    .option('dbtable', """(
        SELECT id,
            NULLIF(amount::text, 'NaN')::numeric AS amount,
            NULLIF(balance::text, 'NaN')::numeric AS balance
        FROM transactions
    ) AS t""") \
    .load()
This pushes the NaN-to-null conversion to PostgreSQL before Spark ever sees the data. I've used this exact fix in production — it's the cleanest solution.
Stream stopped with CheckpointError
Streaming checkpoint is corrupted or was moved/deleted.
# Option A: Delete checkpoint and restart from scratch
dbutils.fs.rm('/checkpoints/my_stream/', recurse=True)
# Then restart the stream — it will reprocess from the beginning

# Option B: Start from a specific version using time travel
stream = spark.readStream.format('delta') \
    .option('startingVersion', 100) \
    .table('source_table')
See my time travel guide for more on replaying from specific versions.
Step 3: Cluster Configuration Checklist
Wrong cluster config is a silent killer — your job runs but slowly, expensively, or crashes under load. Here's what to check:
| Setting | Dev / Test | Production Batch | Production Streaming |
|---|---|---|---|
| Worker type | Standard_DS3_v2 | Standard_DS4_v2 | Standard_DS4_v2 |
| Min workers | 1 | 2 | 2 |
| Max workers | 4 | 8-16 | 8 |
| Autoscale | Yes | Yes | No (fixed for streaming) |
| Spot instances | Yes | Yes (with fallback) | No |
| Photon | Optional | Yes | Yes |
| Auto-terminate | 10 min | 30 min | Never |
Key rules:
- Use job clusters for scheduled jobs, not all-purpose clusters. Job clusters spin down after the task completes, saving 30-50% on costs.
- Don't use spot instances for streaming. Spot eviction kills your stream mid-batch.
- Enable Photon for production. The vectorized engine is 2-3x faster for most workloads, which means fewer DBUs.
For a complete cost optimization strategy, see my Databricks Cost Optimization Checklist.
For pipelines that don't need Databricks-scale compute, a simple DigitalOcean VPS at $6/month can handle scheduled Python ETL just fine — see my VPS ETL guide. For leveling up your Databricks debugging skills, Pluralsight has advanced Spark performance tuning courses.
Step 4: Quick Diagnostic Commands
Bookmark these — you'll use them constantly:
-- Table health check
DESCRIBE DETAIL catalog.schema.my_table
-- Look at: numFiles (too many = small file problem), sizeInBytes, lastModified

-- Small file problem?
-- If numFiles > 10x what you'd expect, run OPTIMIZE
OPTIMIZE catalog.schema.my_table

-- Check data freshness
SELECT MAX(updated_at) AS latest, COUNT(*) AS total_rows
FROM catalog.schema.my_table

-- Check for partition skew
SELECT partition_col, COUNT(*) AS row_count
FROM catalog.schema.my_table
GROUP BY partition_col
ORDER BY row_count DESC
LIMIT 10

-- Table version history (what changed recently?)
DESCRIBE HISTORY catalog.schema.my_table LIMIT 20

-- Spark config dump (what's actually set?)
-- In a notebook cell:
spark.sparkContext.getConf().getAll()
# Check current cluster memory
sc = spark.sparkContext
print(f"Driver memory: {sc._conf.get('spark.driver.memory', 'default')}")
print(f"Executor memory: {sc._conf.get('spark.executor.memory', 'default')}")
print(f"Shuffle partitions: {spark.conf.get('spark.sql.shuffle.partitions')}")
Common Performance Fixes
| Problem | Symptom | Fix |
|---|---|---|
| Small file problem | Slow reads, numFiles very high | OPTIMIZE table; enable autoCompact |
| Data skew | One task takes 10x longer than others | Add salt key or repartition before join |
| Shuffle spill | "Disk spill" in Spark UI task metrics | Increase spark.sql.shuffle.partitions |
| Driver OOM on collect() | Driver crashes on .collect() or .toPandas() |
Use .limit() or .take(n) instead |
| Broadcast join too large | BroadcastExchangeExec timeout | Increase broadcast threshold or disable |
| Slow MERGE | MERGE takes hours on large tables | Add Z-ORDER on merge key columns |
The Debugging Workflow (Summary)
- Check the job run output — often the most readable error
- Search driver logs for the first Exception/Error
- Classify into bucket — memory, data, or config
- Match the error to the fix using the decision tree above
- Check Spark UI if it's a performance issue (skew, spill, shuffle)
- Run diagnostic commands to inspect table health
- Fix and re-run — preferably on a smaller dataset first
Get the Debugging Kit
Want this entire debugging workflow as a printable PDF — error decision trees, log reading guide, cluster config checklist, and diagnostic commands? Grab the Databricks Debugging Kit on Gumroad for $4.99.
Also check out:
- Delta Table Troubleshooting Checklist ($9)
- Databricks Cost Optimization Checklist ($4.99)
- Data Quality Monitoring Playbook ($4.99)
- PySpark Null Handling Cheat Sheet ($4.99)
- Schema Evolution Quick Reference ($4.99)
Building data pipelines that don't break at 3am? That's what PipelinePulse is about. More guides at pipelinepulse.dev.