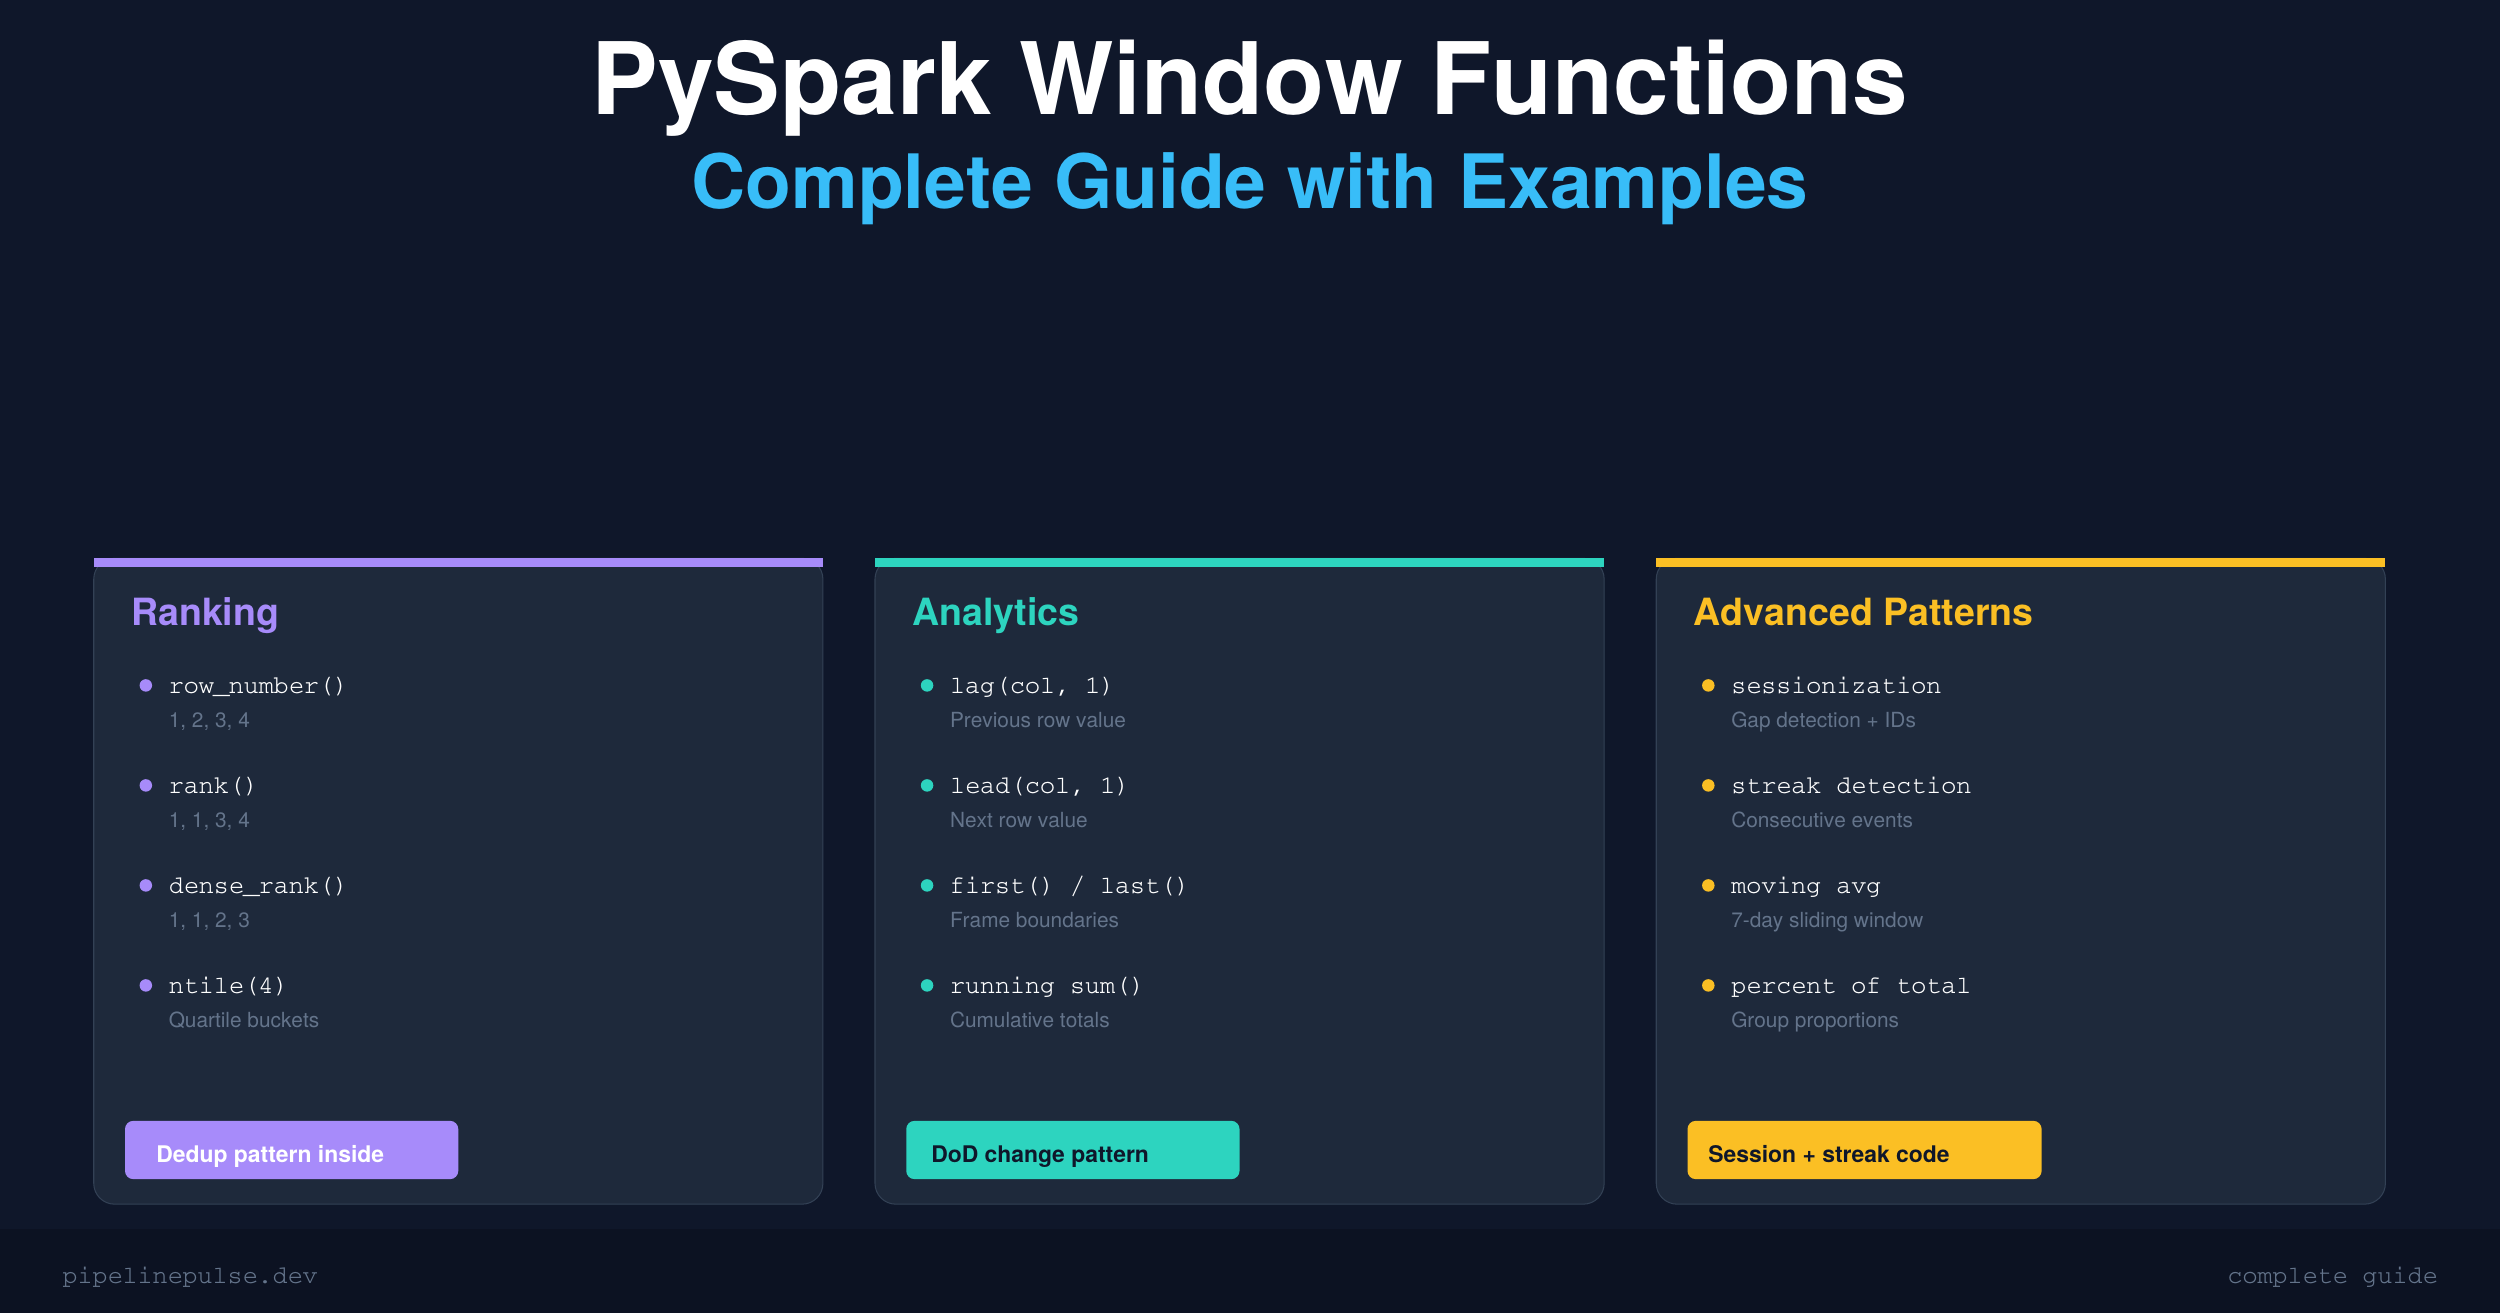
PySpark Window Functions: The Complete Guide with Examples
Master PySpark window functions with real code examples. Covers row_number, rank, lag, lead, running totals, moving averages, sessionization, and more — plus 6 common gotchas that trip up even senior engineers.

Window functions are one of those PySpark features that separate people who write SQL-with-extra-steps from people who actually solve problems efficiently. Once you understand them, you'll use them everywhere — deduplication, running totals, time-series analysis, sessionization, and more.
This guide covers every window function you'll need in production, with real code you can drop into your Databricks notebooks today.
What Are Window Functions?
A window function performs a calculation across a set of rows that are related to the current row — without collapsing them into a single output like groupBy does.
Think of it this way: groupBy gives you one row per group. A window function gives you one result per row, but each result can "see" the other rows in its group.
from pyspark.sql import Window
from pyspark.sql import functions as F

# groupBy — collapses rows
df.groupBy('department').agg(F.avg('salary'))
# Result: 1 row per department

# Window function — keeps all rows, adds a column
w = Window.partitionBy('department')
df.withColumn('dept_avg', F.avg('salary').over(w))
# Result: every row gets its department's average as a new column
This is powerful because you can compare each row to its group without losing detail.
Building a WindowSpec
Every window function needs a WindowSpec that tells Spark how to group and order rows. There are three components:
partitionBy — Define Groups
# Each department is its own window
w = Window.partitionBy('department')

# Multiple partition columns
w = Window.partitionBy('department', 'region')

# No partition = all rows are one group
w = Window.orderBy('created_at')
orderBy — Define Sort Order
# Required for ranking functions
w = Window.partitionBy('department').orderBy('salary')

# Descending order
w = Window.partitionBy('department').orderBy(F.desc('salary'))

# Multiple sort columns (tiebreaker)
w = Window.partitionBy('department').orderBy(F.desc('salary'), 'hire_date')
Frame Boundaries — Control Which Rows
This is where most people get confused, so let me be clear.
When you add orderBy to a window, Spark applies a default frame: from the first row of the partition to the current row. This means sum() becomes a running sum, not a total.
You can override this with rowsBetween or rangeBetween:
# Running total (default with orderBy)
w_running = Window.partitionBy('dept').orderBy('date') \
    .rowsBetween(Window.unboundedPreceding, Window.currentRow)

# Full partition (override the default)
w_full = Window.partitionBy('dept').orderBy('date') \
    .rowsBetween(Window.unboundedPreceding, Window.unboundedFollowing)

# 3-row sliding window (current + 1 before + 1 after)
w_sliding = Window.partitionBy('dept').orderBy('date') \
    .rowsBetween(-1, 1)

# 7-row lookback (current + 6 preceding)
w_7day = Window.partitionBy('dept').orderBy('date') \
    .rowsBetween(-6, 0)
The built-in boundary constants:
Window.unboundedPreceding— first row in the partitionWindow.unboundedFollowing— last row in the partitionWindow.currentRow— the current row (same as0)
Ranking Functions
These assign a position to each row within its partition. All require orderBy.
w = Window.partitionBy('department').orderBy(F.desc('salary'))

df.withColumn('row_num',    F.row_number().over(w)) \
  .withColumn('rank',       F.rank().over(w)) \
  .withColumn('dense_rank', F.dense_rank().over(w)) \
  .withColumn('pct_rank',   F.percent_rank().over(w)) \
  .withColumn('ntile_4',    F.ntile(4).over(w))
How They Handle Ties
This trips people up, so here's a concrete example. Given salaries: 90, 90, 80, 70:
| Function | Output | Behavior |
|---|---|---|
row_number() |
1, 2, 3, 4 | Always unique — arbitrary tiebreak |
rank() |
1, 1, 3, 4 | Ties share rank, next rank skips |
dense_rank() |
1, 1, 2, 3 | Ties share rank, no gaps |
percent_rank() |
0.0, 0.0, 0.67, 1.0 | Relative position as 0–1 fraction |
ntile(4) |
1, 2, 3, 4 | Splits into N roughly equal buckets |
Dedup with row_number() — The #1 Pattern
This is by far the most common window function pattern you'll write. Keep the latest record per key:
w = Window.partitionBy('user_id').orderBy(F.desc('updated_at'))

deduped = df.withColumn('rn', F.row_number().over(w)) \
            .filter(F.col('rn') == 1) \
            .drop('rn')
I use this pattern constantly when dealing with duplicate records in Delta tables. If you're running into dedup issues at scale, my Delta Table Troubleshooting Checklist covers the MERGE-based causes and fixes.
Top-N Per Group
Top 3 earners per department:
w = Window.partitionBy('department').orderBy(F.desc('salary'))

top3 = df.withColumn('rank', F.dense_rank().over(w)) \
         .filter(F.col('rank') <= 3)
Use dense_rank() here instead of row_number() if you want ties to both appear in the result.
📄 Want this as a printable reference?
Get the PySpark Window Functions Cheat Sheet — all 16 functions, comparison tables, copy-paste patterns, and gotchas in a 6-page PDF. $4.99
Analytic (Offset) Functions
These let you access values from other rows relative to the current row — previous values, next values, first and last in the group.
w = Window.partitionBy('product').orderBy('sale_date')

df.withColumn('prev_sale',  F.lag('amount', 1).over(w)) \
  .withColumn('next_sale',  F.lead('amount', 1).over(w)) \
  .withColumn('first_sale', F.first('amount').over(w)) \
  .withColumn('last_sale',  F.last('amount').over(w))
| Function | What it does |
|---|---|
lag(col, n, default) |
Value from n rows before |
lead(col, n, default) |
Value from n rows after |
first(col) |
First value in the frame |
last(col) |
Last value in the frame |
Day-Over-Day Change
w = Window.partitionBy('store_id').orderBy('date')

df.withColumn('prev_revenue', F.lag('revenue', 1).over(w)) \
  .withColumn('dod_change',
      F.when(F.col('prev_revenue').isNotNull(),
          F.round(
              (F.col('revenue') - F.col('prev_revenue'))
              / F.col('prev_revenue') * 100, 2
          )
      ).otherwise(None)
  )
lag() and lead() return null at partition boundaries — the first row has no previous row. Always handle this with .isNotNull() or pass a default: F.lag('col', 1, 0).
If you're working with null values more broadly, check out my guide on handling null values in PySpark. The patterns overlap a lot.
Warning: last() Is Non-Deterministic Without an Explicit Frame
This catches everyone at least once:
# WRONG — returns current row's value, not partition's last value
F.last('amount').over(Window.partitionBy('dept').orderBy('date'))

# CORRECT — explicit frame to get the true last value
w = Window.partitionBy('dept').orderBy('date') \
    .rowsBetween(Window.unboundedPreceding, Window.unboundedFollowing)
F.last('amount').over(w)
When orderBy is specified, the default frame is unboundedPreceding to currentRow. So last() just returns the current row's value — not the partition's last. Always set an explicit frame when using last() with orderBy.
Aggregate Window Functions
Standard aggregations applied over a window instead of collapsing rows.
w = Window.partitionBy('department')

df.withColumn('dept_avg',   F.avg('salary').over(w)) \
  .withColumn('dept_sum',   F.sum('salary').over(w)) \
  .withColumn('dept_count', F.count('*').over(w)) \
  .withColumn('dept_min',   F.min('salary').over(w)) \
  .withColumn('dept_max',   F.max('salary').over(w))
Running Total
w = Window.partitionBy('account_id').orderBy('txn_date') \
    .rowsBetween(Window.unboundedPreceding, Window.currentRow)

df.withColumn('running_balance', F.sum('amount').over(w))
7-Day Moving Average
w = Window.partitionBy('sensor_id').orderBy('date') \
    .rowsBetween(-6, 0)  # current row + 6 preceding = 7 rows

df.withColumn('moving_avg_7d', F.avg('reading').over(w))
rowsBetween(-6, 0) gives a 7-row window. For calendar-based windows (actual 7 days, not 7 rows), use rangeBetween with a unix timestamp column.
Percent of Total
w = Window.partitionBy('region')

df.withColumn('pct_of_region',
    F.round(F.col('sales') / F.sum('sales').over(w) * 100, 2)
)
This is one of those patterns that looks simple but would be ugly to write with groupBy + join.
Advanced Patterns
Sessionization (Gap Detection)
A classic analytics pattern. Group events into sessions based on inactivity gaps:
w = Window.partitionBy('user_id').orderBy('event_time')

sessions = df \
    .withColumn('prev_time', F.lag('event_time', 1).over(w)) \
    .withColumn('gap_seconds',
        F.unix_timestamp('event_time') - F.unix_timestamp('prev_time')
    ) \
    .withColumn('new_session',
        F.when(F.col('gap_seconds') > 1800, 1).otherwise(0)
    ) \
    .withColumn('session_id',
        F.sum('new_session').over(w)
    )
Adjust the 1800-second (30 min) threshold to your use case. This pattern chains three window functions together: lag to get the previous timestamp, a comparison to flag gaps, and a running sum to assign session IDs.
Consecutive Streak Detection
Find consecutive dates (e.g., login streaks, consecutive game appearances):
w = Window.partitionBy('player_id').orderBy('game_date')

streaks = df \
    .withColumn('rn', F.row_number().over(w)) \
    .withColumn('grp',
        F.datediff('game_date', F.lit('1970-01-01').cast('date')) - F.col('rn')
    )
# Consecutive dates share the same grp value
# Group by (player_id, grp) and count to get streak lengths
Combining Multiple Windows
Real-world queries often need several windows at once:
w_dept = Window.partitionBy('department')
w_rank = Window.partitionBy('department').orderBy(F.desc('salary'))
w_run  = Window.partitionBy('department').orderBy('hire_date') \
    .rowsBetween(Window.unboundedPreceding, Window.currentRow)

result = df \
    .withColumn('dept_avg',      F.avg('salary').over(w_dept)) \
    .withColumn('salary_rank',   F.dense_rank().over(w_rank)) \
    .withColumn('running_count', F.count('*').over(w_run)) \
    .withColumn('vs_avg',
        F.round(F.col('salary') - F.col('dept_avg'), 2)
    )
Define your windows up front and reuse them. It's more readable and Spark will optimize the execution plan.
Common Gotchas
After years of writing window functions in Databricks, these are the traps I've hit repeatedly:
1. Default frame with orderBy is not the whole partition. It's RANGE BETWEEN unboundedPreceding AND currentRow. This means sum() and avg() give running results, not totals. If you want the full partition, set an explicit frame with unboundedFollowing.
2. row_number() with ties is non-deterministic. If two rows have the same orderBy value, which gets row 1 vs row 2 is arbitrary. Add a tiebreaker column to make it deterministic.
3. last() without an explicit frame just returns the current row. See the warning in the Analytic Functions section above.
4. rangeBetween requires a numeric orderBy column. String columns throw an AnalysisException. Cast to a numeric type first.
5. Window functions can't be nested. F.sum(F.row_number().over(w)).over(w2) is invalid. Compute in separate .withColumn() steps.
6. Large partitions cause memory pressure. If one partition key has millions of rows, Spark shuffles all of them to one executor. Watch for skew — the same issue I discussed in my OPTIMIZE and Z-ORDER guide.
If window functions are still feeling shaky, it usually means the SQL and PySpark foundations need more reps. DataCamp has an interactive SQL track and a PySpark track that drill these patterns through hands-on exercises — way more effective than just reading about them.
Quick Reference Table
| Function | What it does | Common use case |
|---|---|---|
row_number() |
Sequential int, no ties | Dedup, unique ordering |
rank() |
Ties share, gaps after | Competition-style ranking |
dense_rank() |
Ties share, no gaps | Top-N per group |
percent_rank() |
Rank as 0–1 fraction | Percentile position |
ntile(n) |
Split into n buckets | Quartiles, deciles |
cume_dist() |
Cumulative distribution | What % is below me? |
lag(col, n) |
Value n rows before | Previous value, DoD change |
lead(col, n) |
Value n rows after | Next value, lookahead |
first(col) |
First value in frame | Opening value, baseline |
last(col) |
Last value in frame | Closing value (use explicit frame!) |
sum(col) |
Sum over window | Running totals |
avg(col) |
Average over window | Moving averages |
count(col) |
Count over window | Running counts |
min/max(col) |
Min/max over window | Running extremes |
Get the Cheat Sheet
If you want all of this in a printable 6-page PDF you can keep next to your notebook — with the comparison tables, copy-paste code patterns, and gotchas list — grab the PySpark Window Functions Cheat Sheet on Gumroad for $4.99.
Also check out the rest of the PipelinePulse quick references:
- Delta Table Troubleshooting Checklist ($9)
- Databricks SQL Cheat Sheet ($4.99)
- PySpark Null Handling Cheat Sheet ($4.99)
- Schema Evolution Quick Reference ($4.99)
Building data pipelines that don't break at 3am? That's what PipelinePulse is about. More guides at pipelinepulse.dev.